P-Value Greater Than 0.05: Meaning and Reporting Examples
A p-value above 0.05 does not prove there is no effect. Learn how to interpret non-significant results using effect estimates and confidence intervals.

A p-value greater than 0.05 is commonly described as not statistically significant at the 5% level. It does not prove that there is no effect, no difference or no association. The result may reflect a small effect, substantial uncertainty, limited precision or data that are reasonably compatible with the null. To interpret it properly, examine the effect estimate and confidence interval.
In this guide
How to read a result with p > 0.05
| Finding | Appropriate interpretation |
|---|---|
| p > 0.05 | The result does not meet a prespecified 5% significance threshold. |
| Wide confidence interval | Substantial uncertainty remains; potentially important effects may still be compatible with the data. |
| Narrow confidence interval around the null | The estimate is more precise; assess whether the interval excludes effects considered practically important. |
| Non-significant result | This alone does not establish no effect or equivalence. |
A reporting sentence that follows this logic:
Participants in the intervention group had an estimated 25% lower risk of the outcome than those in the comparison group (RR 0.75, 95% CI 0.55-1.03; p = 0.08).
What does p > 0.05 mean in simple terms?
Your analysis gives:
p = 0.08
The first temptation is disappointment.
The second is usually worse:
“There was no association.”
That conclusion may be much stronger than your data allow.
A p-value above 0.05 tells you that the result did not cross a chosen significance threshold under the statistical test you used.
It does not tell you that nothing happened.
In a conventional hypothesis test, the p-value measures how compatible the observed data are with a specified statistical model, usually one that includes a null hypothesis.
If you prespecified a 5% significance level and obtain:
p = 0.08
the result does not meet the conventional p < 0.05 rule.
It is therefore often described as not statistically significant at the 5% level.
That is a statement about a testing threshold.
It is not proof that the null hypothesis is true.
“Not statistically significant” and “no effect” are not the same conclusion.
One describes the result of a statistical decision rule.
The other makes a substantive claim about the phenomenon you are studying.
a result with p = 0.08
Suppose a study estimates:
- Risk ratio = 0.75
- 95% CI = 0.55 to 1.03
- p = 0.08
A rushed conclusion is:
“The intervention had no effect because p > 0.05.”
But look at the estimate.
A risk ratio of 0.75 corresponds to an estimated 25% lower risk in the intervention group.
Now look at the confidence interval.
The data are compatible, under the model and assumptions used, with effects ranging from a substantial reduction in risk to a very small increase.
That is not a precise estimate of “no effect.”
It is an uncertain estimate.
The distinction matters.
Why can a non-significant result still be important?
Statistical significance depends on more than the estimated effect.
It also depends on factors such as:
- sample size;
- variability;
- event frequency;
- measurement precision;
- the statistical model;
- the chosen significance threshold.
A study can therefore produce a potentially important point estimate but remain too imprecise to rule out the null value.
This is one reason researchers should not reduce an entire result to:
significant / not significant.
Instead ask:
What effects remain compatible with the data?
That question moves you toward the confidence interval.
Bench Check: “We accepted the null hypothesis”
You wrote:
“The relationship was not statistically significant, so the null hypothesis was accepted.”
Bench check: Usually remove that sentence.
Failure to reject a null hypothesis does not establish that the null is true.
A more cautious testing-language formulation is:
“The data did not provide sufficient evidence to reject the null hypothesis at the prespecified significance level.”
But even that is incomplete if you do not report the estimate and uncertainty.
A better results section usually tells the reader what was estimated.
Two p > 0.05 results can mean very different things
Consider two hypothetical studies.
Study A
- Difference = 0.1 points
- 95% CI = -0.2 to 0.4
- p > 0.05
The estimated effect is close to zero and the confidence interval is narrow.
If a difference smaller than one point would be practically unimportant, this result may provide useful evidence that a large meaningful effect is unlikely.
Study B
- Difference = 0.1 points
- 95% CI = -8.0 to 8.2
- p > 0.05
Same point estimate.
Same broad “not significant” label.
Very different uncertainty.
This interval remains compatible with large effects in either direction.
Calling both results “no effect” hides the most important difference between them.
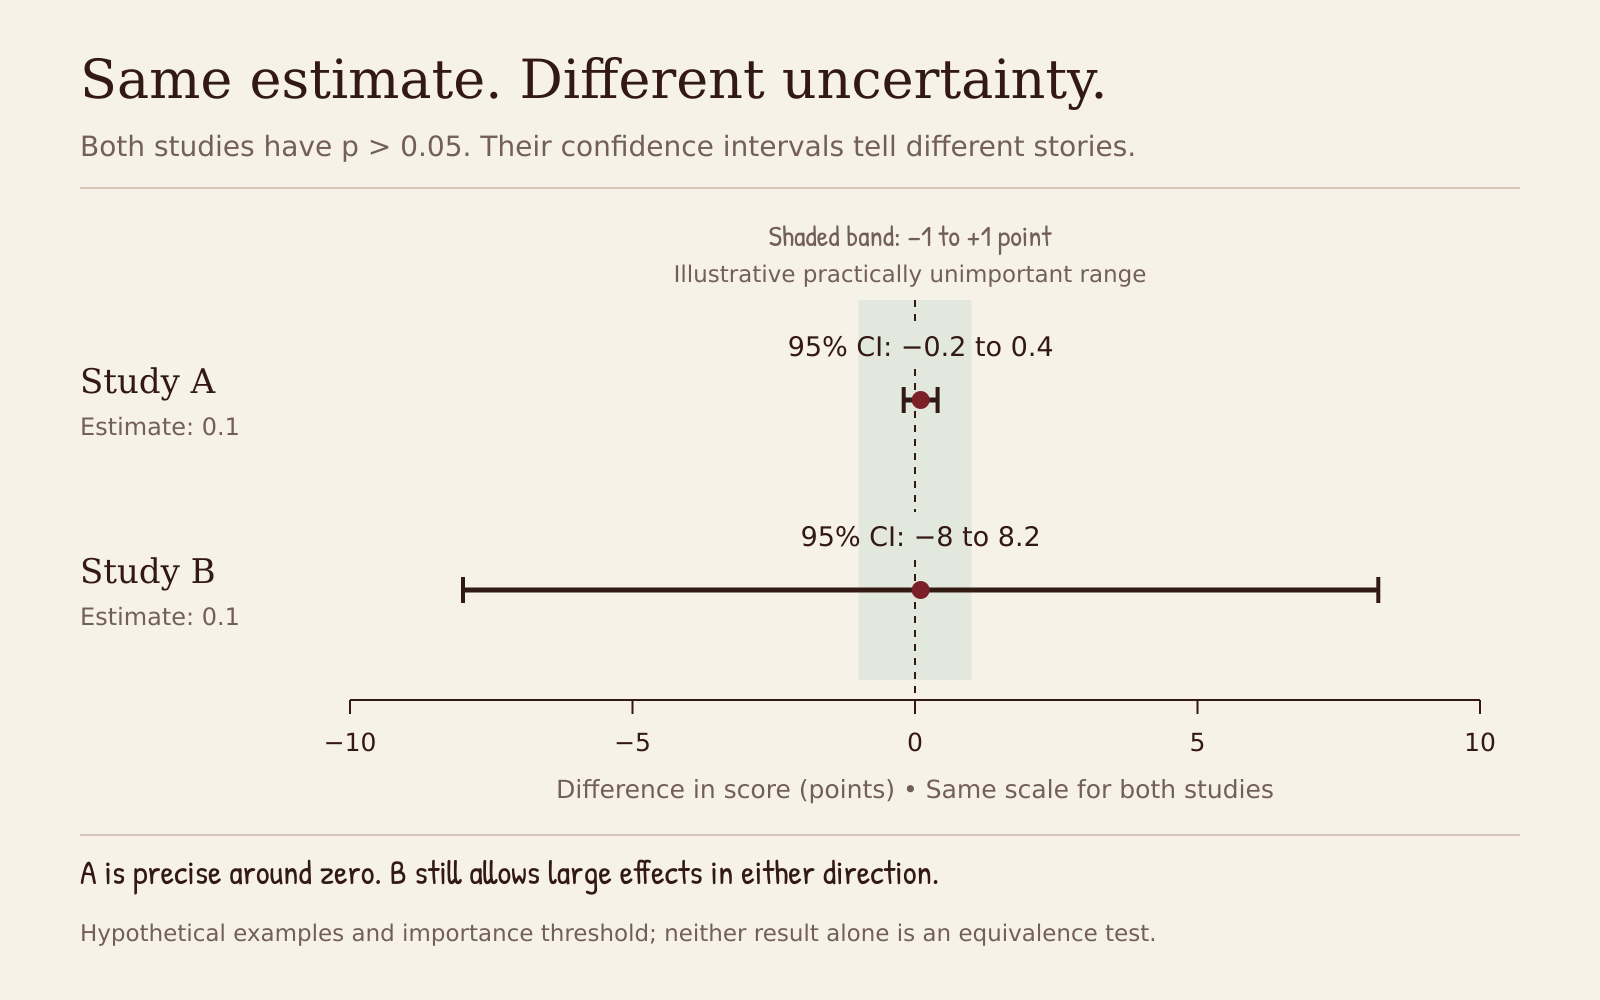
A non-significant result can be precise or highly uncertain. Here Study A excludes differences beyond the hypothetical ±1-point importance threshold; Study B does not. The margin is illustrative, not a universal standard. These are not formal equivalence tests.
The practical lesson
When p > 0.05, ask:
- Where is the point estimate?
- How wide is the confidence interval?
- Does the interval include effects that would matter?
- Is the study precise enough to answer the substantive question?
- What limitations of the design affect the interpretation?
Is p = 0.051 really different from p = 0.049?
Not in the dramatic way scientific writing sometimes suggests.
If 0.05 is your prespecified significance level, the two numbers fall on different sides of the formal threshold.
But they do not represent two entirely different universes of evidence.
Treating p = 0.049 as a meaningful discovery and p = 0.051 as “nothing” throws away the continuity of the evidence.
The threshold can serve a decision rule.
It should not become your entire interpretation.
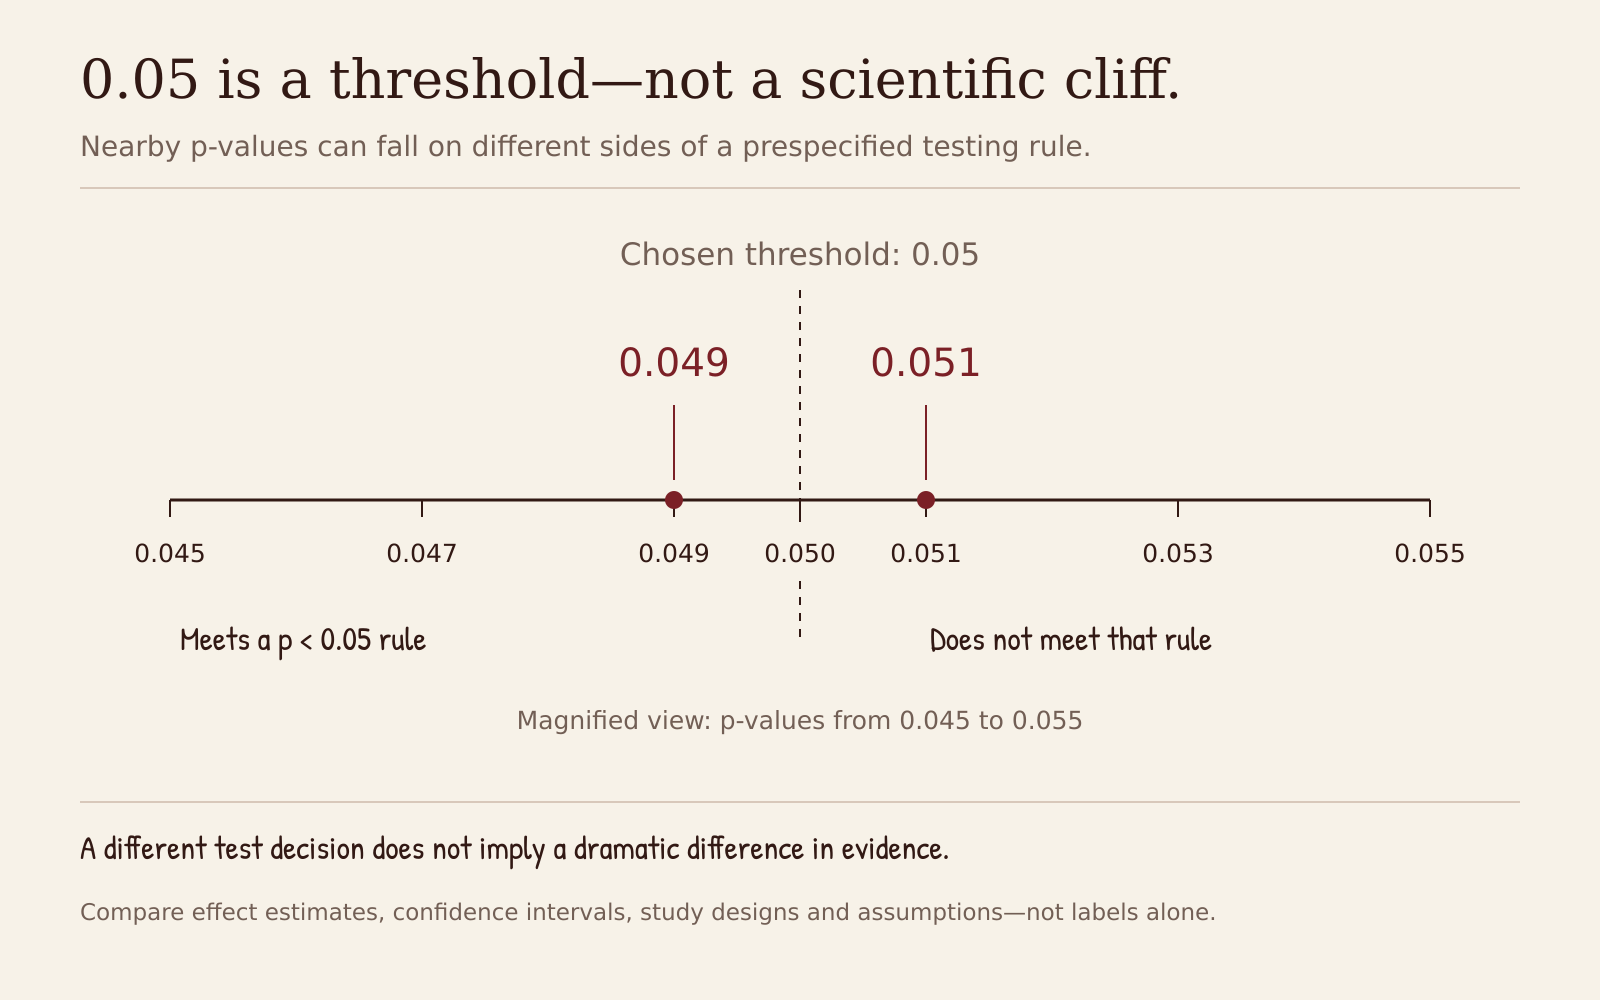
The values fall on opposite sides of a p < 0.05 decision rule but do not represent a sudden transformation in evidence. Interpretation still requires the effect estimate, uncertainty, study design and assumptions. Values are illustrative; the displayed axis is magnified.
Does p > 0.05 mean my sample size was too small?
Not necessarily.
A non-significant p-value alone cannot diagnose the reason.
A wide confidence interval may indicate limited precision, which can arise partly from a small sample, high variability or few events.
But automatically responding to p > 0.05 with:
“I needed a larger sample”
can become retrospective reasoning based on the result you wanted.
Sample-size planning should be justified before the analysis, based on the study objective, desired precision or power and defensible assumptions.
Does p > 0.05 prove equivalence?
No.
Showing that a conventional superiority test is not statistically significant is not the same as demonstrating that two treatments, groups or conditions are equivalent.
Equivalence and non-inferiority questions require designs and decision rules built for those purposes.
“No statistically significant difference” should not be silently upgraded to “the groups are the same.”
Where to go next: A large p-value is not evidence of no effect. See what the interval adds in how to interpret a 95% confidence interval and how the three numbers work together in p-values, confidence intervals and effect sizes.
What do I actually write in my results section?
Avoid:
There was no relationship between exposure and the outcome because p > 0.05.
Prefer reporting the estimate itself, using the reporting sentence shown near the top of this article.
Then interpret the uncertainty appropriately:
The confidence interval included the null value and remained compatible with both a potentially important reduction and little or no effect.
Exactly how you word this will depend on the effect measure, study design and substantive context.
Do not copy the sentence while changing only the numbers.
Search your thesis or manuscript for:
- “there was no effect”
- “there was no association”
- “the null hypothesis was accepted”
- “the variables were not related”
For each sentence, check whether it was based only on p > 0.05.
Then replace the significance label with the actual estimate and confidence interval.
Ask what the data can genuinely rule out.
Frequently asked questions
- What does p = 0.08 mean?
At a conventional 5% significance level, p = 0.08 would be described as not statistically significant. It does not prove that the null hypothesis is true. Interpret it alongside the effect estimate, confidence interval and study design.
- Does p > 0.05 mean there is no relationship?
No. It means the analysis did not meet the chosen significance rule. The confidence interval helps show which effect sizes remain compatible with the data.
- Can I say “there was no statistically significant association”?
You can accurately describe the statistical test that way, but do not allow the phrase to substitute for reporting the estimate and uncertainty.
- Can a non-significant finding still be clinically or practically important?
Yes. A point estimate may be potentially important even when uncertainty is too large for the result to cross a conventional significance threshold.
- Is a non-significant result a failed study?
No. A well-designed study can produce an informative estimate regardless of whether p < 0.05. The scientific value depends on the question, design, precision and interpretation.
Read How to Interpret a 95% Confidence Interval next, then use the Methods Bench Manuscript Outline Planner to check whether your results section reports estimates and uncertainty rather than significance labels alone.
References and further reading
- 1.Greenland S, Senn SJ, Rothman KJ, et al. Statistical tests, P values, confidence intervals, and power: a guide to misinterpretations. European Journal of Epidemiology. 2016. https://pmc.ncbi.nlm.nih.gov/articles/PMC4877414/
- 2.Amrhein V, Greenland S, McShane B. Scientists rise up against statistical significance. Nature. 2019. https://www.nature.com/articles/d41586-019-00857-9
- 3.Wasserstein RL, Lazar NA. The ASA's Statement on p-Values: Context, Process, and Purpose. The American Statistician. 2016. https://www.tandfonline.com/doi/full/10.1080/00031305.2016.1154108
- 4.Reporting and interpretation of results from clinical trials where results are not statistically significant. BMJ Open. https://bmjopen.bmj.com/content/9/9/e024785
- 5.Interpretation of confidence intervals in clinical trials with non-significant results. BMJ Open. https://bmjopen.bmj.com/content/7/7/e017288
Continue your research
Three useful next steps for this topic.
Research notes, once a week
Practical research guidance, useful tools and funding opportunities in your inbox.