P-Value Less Than 0.05: Meaning and Reporting Examples
What does p < 0.05 mean? Learn what a statistically significant p-value tells you, what it does not tell you and how to report it correctly.

A p-value below 0.05 is commonly described as statistically significant at the 5% level. In a conventional hypothesis test, it means the observed data would be relatively unusual if the null hypothesis and the statistical model used were correct. It does not mean there is a 95% chance your hypothesis is true, and it does not tell you whether the effect is large or important.
You run the analysis.
Your software gives you:
p = 0.032
Relief.
It is below 0.05.
You type: “There was a significant association.”
Before you move on, there are a few things that number can tell you, and several things it absolutely cannot.
In this guide
What does p < 0.05 mean in simple terms?
Most introductory statistical tests begin with a null hypothesis. The null might say that there is no difference between two groups, no association between two variables or no effect of an intervention.
The p-value asks a narrower question:
If the null hypothesis and the assumptions of the statistical model were correct, how compatible are the observed data with that model?
Smaller p-values indicate greater incompatibility between the observed data and the tested null model.
So if your software reports, for a generic test, p = 0.032, a useful plain-language interpretation is:
Under the null hypothesis and the statistical assumptions used, results at least as incompatible with the null as those observed would be relatively unusual.
That is less dramatic than “my hypothesis has been proved.”
It is also more accurate.
A worked example: estimate, interval and p-value
Imagine a hypothetical analysis estimating the difference in uptake between two counselling approaches. The following summary values are invented for teaching; they are not results from a real study.
The estimated difference is 12 percentage points, with a 95% confidence interval from 4 to 20 percentage points. Using the same two-sided normal/Wald calculation for the interval and test gives p ≈ 0.0033 (approximately 0.003 when reported to three decimal places).
Read the result in three parts. Twelve percentage points describes the estimated magnitude and direction. The confidence interval describes uncertainty under the model. The p-value indicates incompatibility with the tested null model and its assumptions; it does not measure practical importance or establish causation.
A reporting sentence is: “Uptake was estimated to be 12 percentage points higher in the intervention group than in the comparison group (95% CI 4–20 percentage points; p = 0.003, rounded).”
The calculation is consistent: the standard error is approximately 8 ÷ 1.96 = 4.082 percentage points; the test statistic is 12 ÷ 4.082 = 2.94; the two-sided p-value is approximately 0.00328. This is a simplified illustrative calculation. For a real analysis, report the estimates, intervals and p-values produced by the appropriate method for the actual design and data.
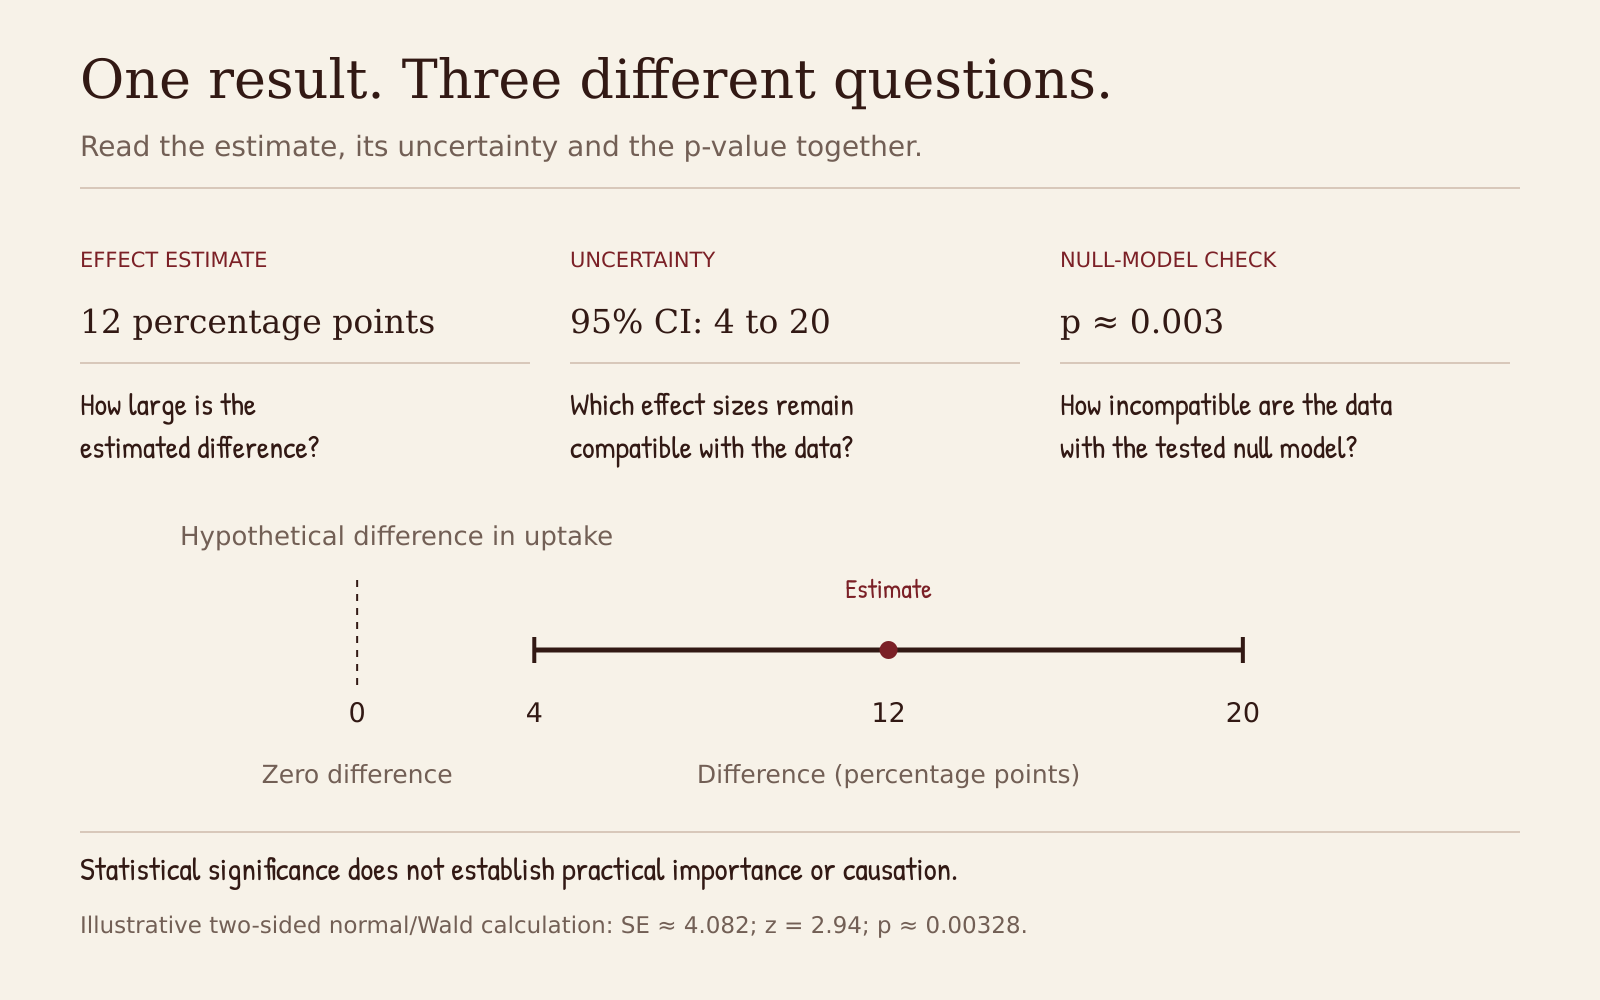
The point estimate describes magnitude and direction; the confidence interval describes uncertainty under the model; the p-value assesses incompatibility with the tested null model. The hypothetical numbers use one consistent two-sided normal/Wald calculation. They do not establish causation or practical importance.
Does p < 0.05 mean my hypothesis is probably true?
No.
This is one of the most common p-value errors.
A p-value of 0.032 does not mean:
“There is a 3.2% probability that the null hypothesis is true.”
It also does not mean:
“There is a 96.8% probability that my alternative hypothesis is correct.”
The conventional p-value is calculated under an assumption about the null hypothesis. It does not calculate the probability that the hypothesis itself is true.
The American Statistical Association has specifically warned against this interpretation.
You wrote:
“Since p = 0.032, there is a 96.8% probability that the intervention was effective.”
Bench check: Delete it.
The p-value does not provide that probability.
Does p < 0.05 mean the result is important?
Also no.
Suppose:
Study A finds a 0.2-point improvement on a 100-point score, with p < 0.001.
Study B finds a 5-point improvement, with p = 0.06.
Which finding matters more?
You cannot answer from the p-values.
Statistical significance is affected by the magnitude of the effect, variability, sample size and the statistical model. A very large study can produce a tiny p-value for a very small effect. A smaller study can produce a larger p-value while its data remain compatible with effects that would matter in practice.
That is why you should ask:
- How large is the estimated effect?
- How precise is it?
- What values are compatible with the confidence interval?
- Would that magnitude matter clinically, socially or programmatically?
- Was the study designed well enough for the estimate to be credible?
Statistics cannot decide importance on your behalf.
Why is 0.05 used?
The 0.05 threshold is a convention. It is not a scientific law.
Many fields use 5% as a pre-specified significance level, which makes p < 0.05 a familiar decision rule. But treating 0.05 as a hard border can produce absurd interpretations.
Consider:
- p = 0.049
- p = 0.051
It is difficult to defend the idea that the first result represents a scientific discovery while the second represents no evidence at all.
The numbers are extremely close.
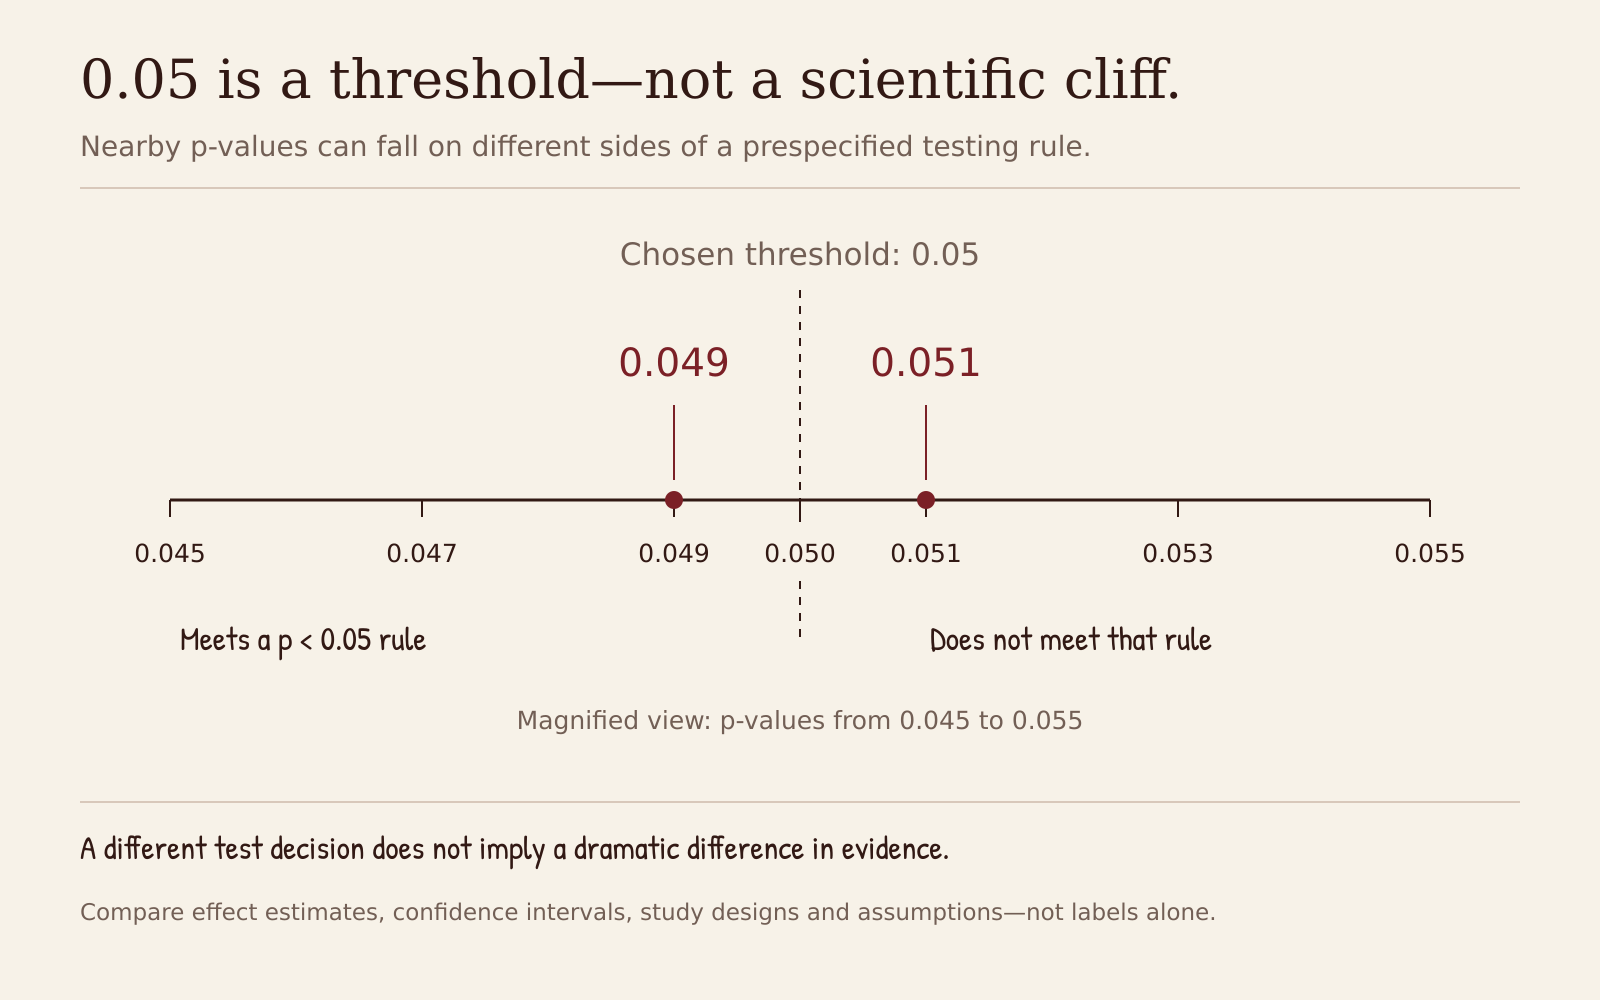
The values fall on opposite sides of a p < 0.05 decision rule but do not represent a sudden transformation in evidence. Interpretation still requires the effect estimate, uncertainty, study design and assumptions. Values are illustrative; the displayed axis is magnified.
Do not turn a continuous measure into a scientific traffic light.
“Below 0.05” and “above 0.05” can be useful labels for a pre-specified testing rule. They should not replace interpretation.
What should I look at besides the p-value?
At minimum, look at the estimate and its uncertainty.
For example:
In the hypothetical worked example above, contraceptive uptake was 12 percentage points higher in the intervention group than in the comparison group (95% CI 4 to 20 percentage points; p = 0.003, rounded).
Now the reader can see:
- Direction: uptake was higher in the intervention group.
- Magnitude: the estimated difference was 12 percentage points.
- Uncertainty: the confidence interval ranged from 4 to 20 percentage points.
- Hypothesis-test information: p = 0.003, rounded.
Then consider the study itself. A small p-value cannot rescue poor measurement, selection bias, inappropriate modelling or a badly designed comparison.
Where to go next: A p-value alone rarely answers the question. Read the estimate alongside its precision in how to interpret a 95% confidence interval, and decide whether the finding matters using statistically significant does not mean important.
What do I actually write in my results section?
Avoid writing only:
There was a significant association between counselling approach and uptake (p < 0.05).
A stronger version is:
Contraceptive uptake was 12 percentage points higher in the intervention group than in the comparison group (95% CI 4 to 20 percentage points; p = 0.003, rounded).
If you are reporting a regression model, report the appropriate effect estimate and interval for that model.
Do not copy this wording blindly. The effect measure, unit and interpretation should match your analysis.
Find one sentence in your results chapter that contains the phrase “statistically significant.”
Ask:
- Have I reported the actual estimate?
- Have I reported its uncertainty?
- Can the reader tell whether the result is large enough to matter?
- Have I interpreted only as far as the design allows?
If not, the p-value is doing too much work.
Frequently asked questions
- Is p = 0.05 statistically significant?
That depends on the decision rule specified for the analysis. Some conventions use p < 0.05, while others may use p ≤ 0.05. More importantly, p = 0.049 and p = 0.051 should not be treated as scientifically opposite results simply because they fall on different sides of a conventional threshold.
- Does p < 0.05 mean the result happened by chance less than 5% of the time?
No. A p-value is not the probability that “chance caused the result.” It is calculated under a specified statistical model and hypothesis.
- Is a smaller p-value always better?
No. A smaller p-value indicates greater incompatibility with the tested null model, under the assumptions used. It does not mean the effect is larger, more useful or more important.
- Should I report exact p-values?
Usually, report exact p-values where practical, alongside the estimate and confidence interval. Extremely small values may be reported using an appropriate threshold such as p < 0.001, depending on the journal or reporting standard.
Use the Methods Bench Manuscript Outline Planner to check whether your results section reports estimates, uncertainty and p-values in a way that actually answers your objectives.
References and further reading
- 1.Wasserstein RL, Lazar NA. The ASA's Statement on p-Values: Context, Process, and Purpose. The American Statistician. 2016. https://www.tandfonline.com/doi/full/10.1080/00031305.2016.1154108
- 2.American Statistical Association. ASA statement on statistical significance and p-values. https://magazine.amstat.org/blog/2016/03/07/pvalue-mar16/
- 3.American Statistical Association President's Task Force. Statistical significance and replicability. https://magazine.amstat.org/blog/2021/08/01/task-force-statement-p-value/
- 4.STROBE Statement. Checklist for observational studies. https://www.equator-network.org/reporting-guidelines/strobe/
- 5.CONSORT. Reporting guidance for randomized trials. https://www.consort-statement.org/
Continue your research
Three useful next steps for this topic.
Research notes, once a week
Practical research guidance, useful tools and funding opportunities in your inbox.