Mixed Methods Joint Display: A Worked Example
Connect quantitative findings and qualitative explanations in a joint display, including disagreement, limitations and the resulting integrated inference.

A table with a survey result on the left and an interview quotation on the right is not automatically integration. The important work is explaining how the two forms of evidence relate and what you can understand by considering them together.
A joint display makes that reasoning visible. It can identify convergence, expansion, tension or gaps—but only when the comparison has a clear purpose.
In this guide
Choose the connection before choosing the layout
Ask what you are trying to integrate: the same construct, a result and its possible explanation, different stages of a process, or evidence from different levels of a system.
The participants, settings and time points need to be understood. Interviews with managers cannot automatically explain individual survey responses from users. They may provide relevant organisational context, but the link is indirect and should be described as such.
Fetters, Curry and Creswell. Achieving Integration in Mixed Methods Designs. 2013. discusses integration across mixed-methods design, methods and interpretation, including the role of joint displays. The table is a means of reasoning, not a substitute for a coherent mixed-methods design.
Add an interpretation column
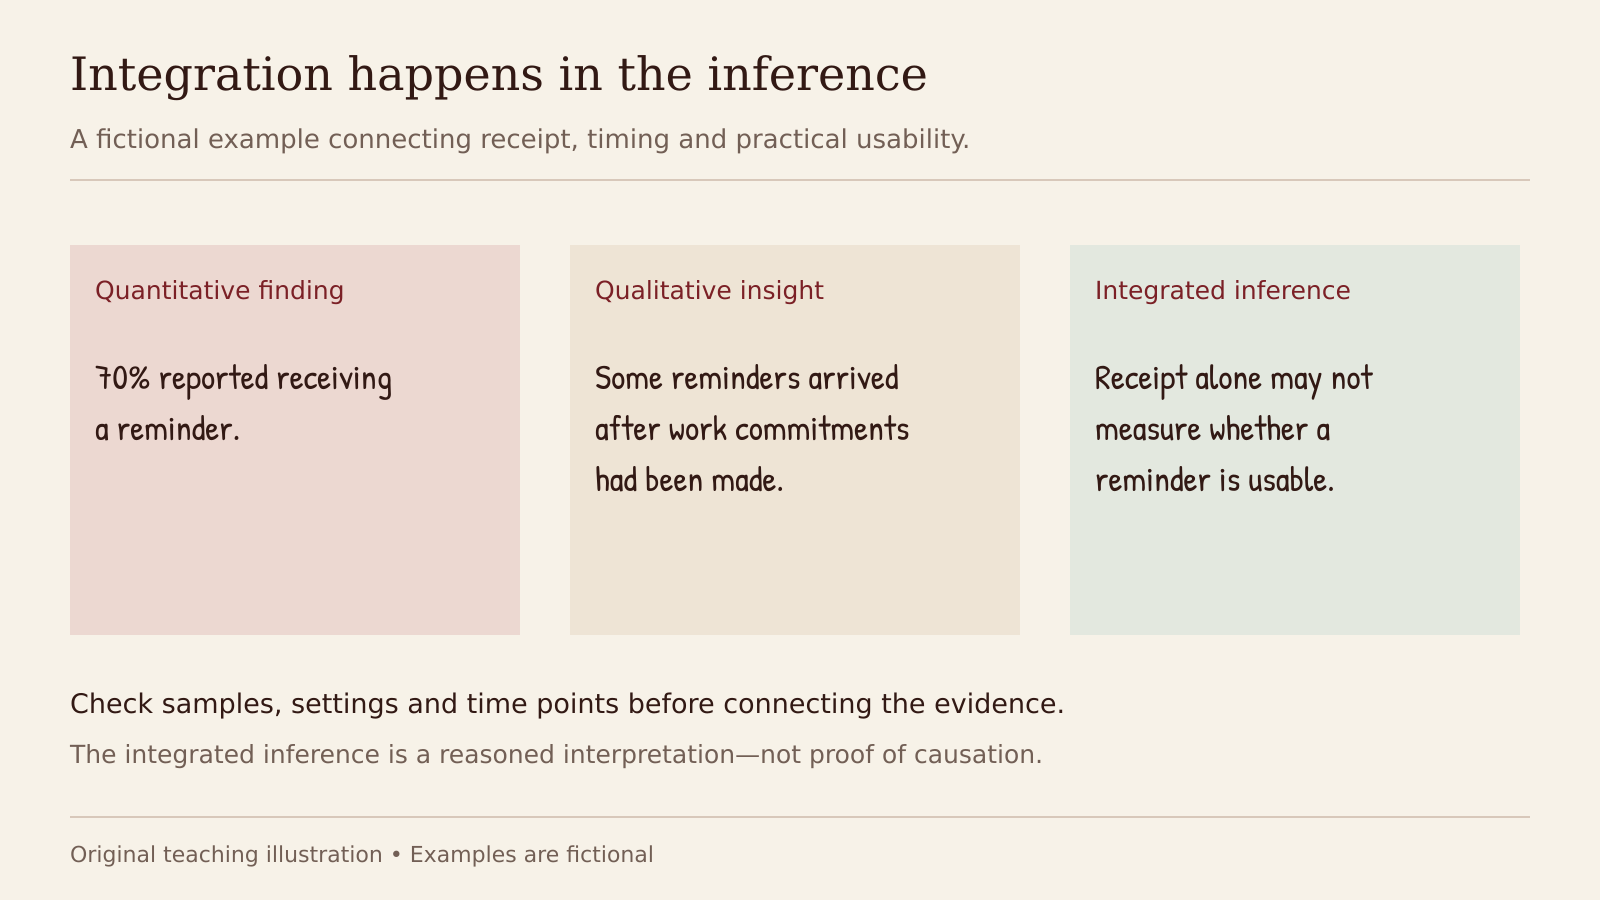
A fictional example connecting receipt, timing and practical usability.
Consider this fictional example from a study of appointment systems. The figures and qualitative summaries are invented for illustration.
| Quantitative finding | Qualitative insight | Integrated interpretation |
|---|---|---|
| 70% reported receiving a reminder | Some participants said reminders arrived after they had committed to work | Receipt may not capture whether the timing supports attendance |
| Attendance varied across clinics | Staff described differences in rescheduling authority | Local processes may help explain variation; the data do not establish causation |
| Satisfaction scores were generally high | Interviews included criticism of waiting arrangements | Overall satisfaction may coexist with specific service problems |
The final column is where the argument develops. It should not merely repeat both earlier cells with “therefore” between them.
Keep the evidence traceable
Link quantitative entries to tables, denominators and models. Link qualitative entries to supported analytic findings and relevant source material. Avoid selecting one colourful quotation to explain a numerical pattern that the wider qualitative analysis does not support.
If the two datasets concern different samples, explain the implications. An explanatory claim is stronger when the design deliberately connects participants or cases than when the link is assembled retrospectively without supporting information.
Investigate disagreement
Apparent contradiction may reflect different questions, social settings, time frames or measurement limitations. A survey asking about overall satisfaction and an interview exploring one difficult visit need not produce identical impressions.
Do not force agreement by treating qualitative evidence as a decorative explanation for the quantitative result. Equally, do not assume an interview account automatically overturns a numerical pattern. Examine what each dataset can and cannot establish.
Write the integrated inference cautiously
Weak: “The interviews confirmed the survey.”
Stronger, for the fictional example: “The combined findings suggest that reminder receipt alone is an incomplete indicator of a usable reminder system: interviews identified timing and rescheduling constraints not captured by the survey item.”
This is a new insight about measurement and process, not proof that reminder timing caused non-attendance. An integrated conclusion should retain the limitations of both components.
Use the display to improve the study
A joint display can reveal that an important survey pattern has no qualitative coverage, or that interviews raise a process the quantitative instrument never measured. Report these gaps and use them to guide future work rather than quietly filling them with speculation.
Copy this joint-display structure
| Comparison unit | Quantitative finding and uncertainty | Qualitative interpretation and context | Relationship between strands | Integrated inference and limits |
|---|---|---|---|---|
| Define the group, site or question | State the measure, denominator and time point | Link the interpretation to its evidence | Convergence, complementarity, tension or silence | Explain what the combined evidence supports |
This is a working template. Do not force both strands into identical samples or treat silence in one strand as contradiction. Keep a source reference for each entry so the display can be checked against the underlying analyses.
Before finalising the table, ask: What can a reader understand here that neither dataset alone communicates? If the answer is unclear, the display needs more analytical work. Explore the research library for related design and reporting guidance.
Continue your research
Three useful next steps for this topic.
Research notes, once a week
Practical research guidance, useful tools and funding opportunities in your inbox.