Odds Ratio vs Risk Ratio: A Worked Example
See why an odds ratio and risk ratio can describe the same data with different numbers, and how to report each without exaggerating the finding.
An odds ratio of 2 does not automatically mean that an outcome is twice as likely. Odds and probability are different quantities, and the difference becomes important when an outcome is common.
Understanding that distinction helps you interpret a model, write a results sentence and avoid turning a defensible estimate into an exaggerated claim.
In this guide
Start with a small example
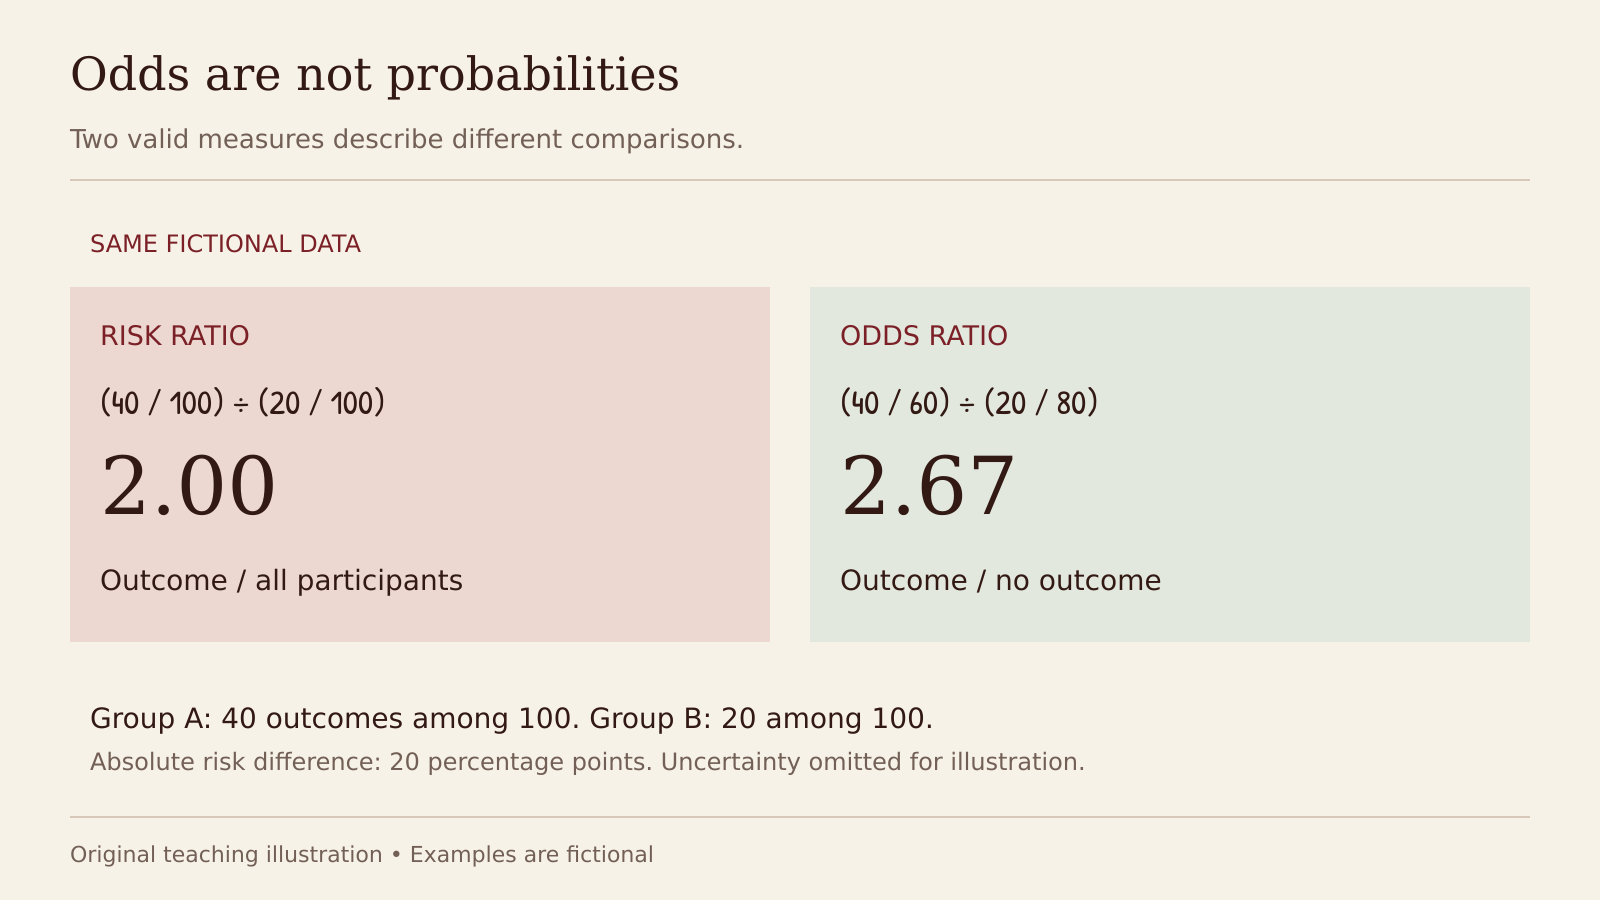
Two valid measures describe different comparisons.
Imagine a fictional cohort with 100 participants in each of two groups, all followed over the same period. The outcome occurs in 40 participants in group A and 20 in group B.
| Quantity | Group A | Group B |
|---|---|---|
| Participants with outcome | 40 | 20 |
| Participants without outcome | 60 | 80 |
| Risk over the period | 40/100 = 0.40 | 20/100 = 0.20 |
| Odds | 40/60 = 0.667 | 20/80 = 0.25 |
The risk ratio is 0.40 divided by 0.20: 2.0. The odds ratio is (40/60) divided by (20/80): approximately 2.67.
These numbers come from exactly the same data. The odds ratio is not an error; it measures a different comparison. The CDC. Principles of Epidemiology, Lesson 3, Section 5: Measures of Association. Archived educational resource. explains common epidemiological measures of association and their interpretation.
Write the corresponding sentence
For the risk ratio: “The observed risk in group A was twice that in group B over the follow-up period.” For the odds ratio: “The observed odds in group A were approximately 2.67 times those in group B.”
Do not replace “odds” with “risk” or “likelihood” because it sounds more familiar. Explain the measure if the audience needs help.
The absolute difference also matters: 40% minus 20% is 20 percentage points. Reporting absolute frequencies or risks alongside a relative measure can make the finding easier to understand. These fictional calculations omit uncertainty for teaching; a real analysis should report appropriate interval estimates.
Why the rare-outcome shortcut has limits
When probabilities are small, odds and risks are numerically close. For example, a probability of 0.01 corresponds to odds of 0.01/0.99, approximately 0.0101. That is why odds ratios can approximate risk ratios under some conditions.
But “rare” is not permission to relabel every odds ratio. The study design and sampling process still matter. In a conventional case-control study, the sampled proportion of cases does not generally estimate population risk directly.
Know what your model estimates
Logistic regression estimates odds ratios after exponentiating its coefficients. An adjusted odds ratio compares conditional odds under the model; it is not automatically an adjusted risk ratio.
Do not convert an adjusted odds ratio to a risk ratio using an arbitrary baseline percentage. Estimating adjusted risks or other measures requires a method appropriate to the model, design and target comparison.
Odds ratios also have properties that can make crude and adjusted estimates differ even without confounding. Avoid interpreting every change after adjustment as proof that a variable was a confounder.
Check the study design before choosing words
Cross-sectional data commonly concern prevalence, not incidence risk over follow-up. A cross-sectional association should not casually be described as a future risk. Similarly, an association from an observational study does not become causal because it is adjusted.
Before finalising a results sentence, identify the outcome, reference group, time frame, measure, adjustment and uncertainty. If those elements are clear, the number is much less likely to mislead. Continue with how to report quantitative results to place the estimate in a complete results paragraph.
Continue your research
Three useful next steps for this topic.
Research notes, once a week
Practical research guidance, useful tools and funding opportunities in your inbox.