Paired Pre–Post Data: Check the Pairs Before Analysis
Audit identifiers, follow-up windows and attrition before comparing pre- and post-scores, and report the population your estimate represents.
A baseline file with 80 rows and a follow-up file with 70 rows does not contain 70 valid pairs by definition. Some participants may be duplicated, identifiers may differ and a follow-up record may belong to someone without a usable baseline score.
Before comparing pre- and post-scores, establish who was measured at both times and what the comparison can represent. Pairing is a data relationship, not an assumption based on row order.
In this guide
Join by a stable identifier
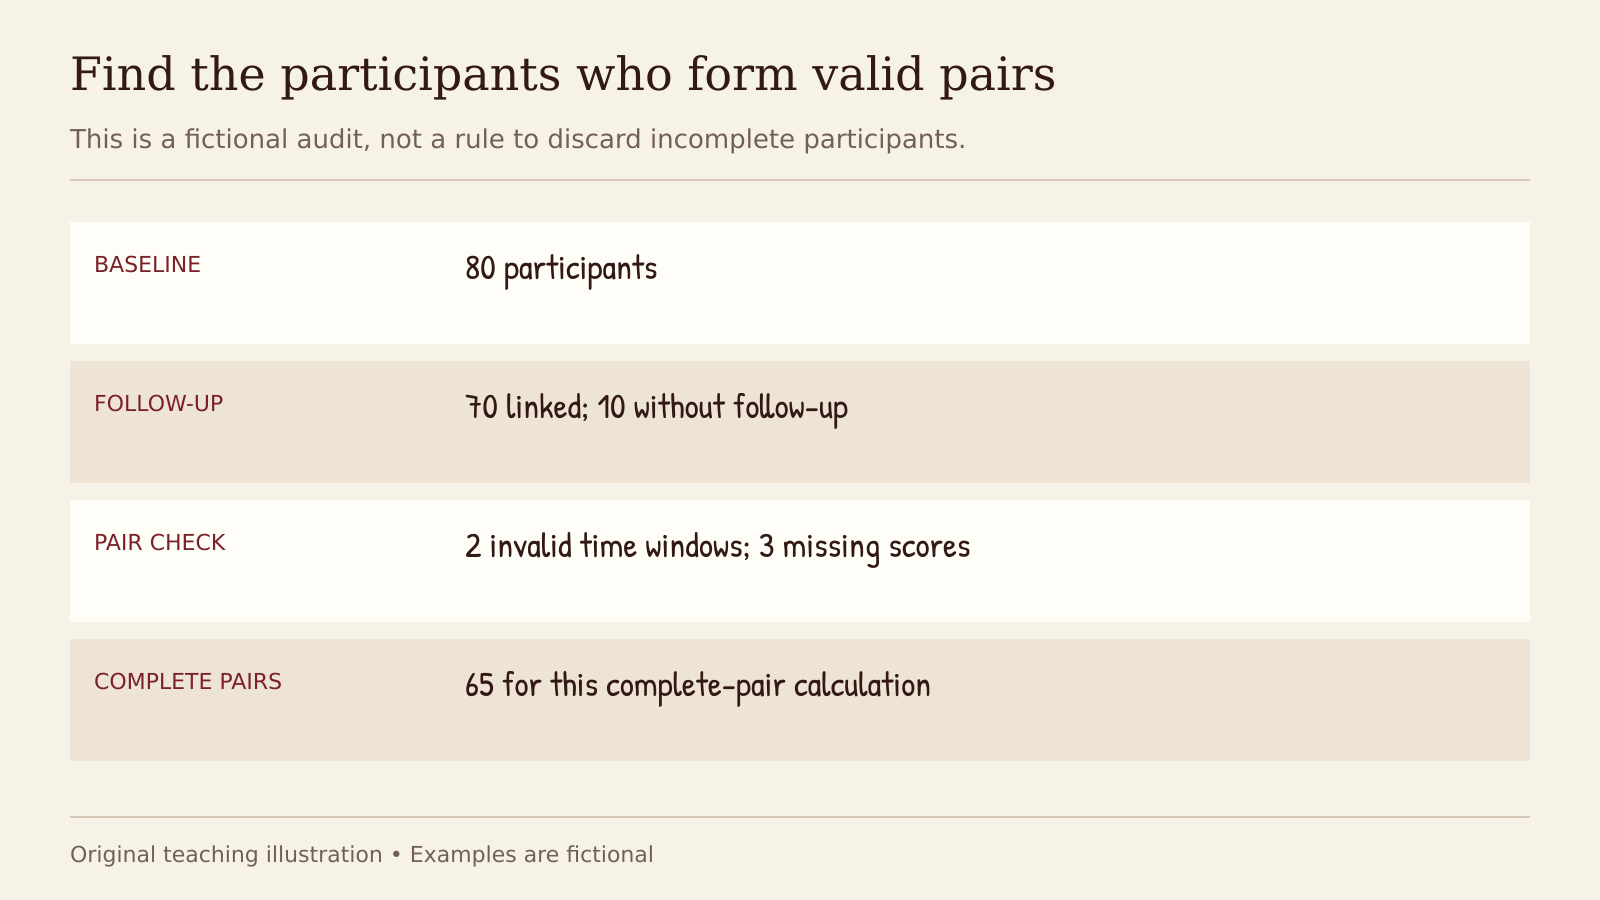
This is a fictional audit, not a rule to discard incomplete participants.
Use a verified participant key. Never match records because they occupy the same spreadsheet row after sorting. Check duplicate identifiers within each time point before merging.
If repeated assessments are possible, define which observation belongs to each analysis window. A rule such as “use the assessment closest to the scheduled date within the permitted window” must be appropriate to the protocol and documented, not chosen after comparing scores.
Reconcile the analysis population
In a fictional training evaluation, 80 participants have baseline scores. Seventy attend follow-up, but two follow-up records have unresolved identifiers and three lack a usable score. That leaves 65 confirmed complete pairs, assuming all 65 also have usable baseline scores.
Record each step rather than reporting only the final number. Investigate unresolved identifiers under the project’s data procedures; do not guess a match from a similar name.
Compare like with like
The average baseline score for all 80 participants and the average follow-up score for 65 participants describe different groups. Their difference is not necessarily the average within-person change.
For the paired subset, calculate change using the same participants at both times. State that the estimate describes those with complete paired measurements unless the analysis supports a broader target population under explicit assumptions.
Also verify that the measure, scoring rule, administration mode and units remained comparable. A changed questionnaire can create apparent improvement unrelated to actual change in the construct.
Investigate attrition
Describe who lacks follow-up and known reasons. Compare relevant observed baseline characteristics between retained and non-retained participants, while recognising that similarity on measured variables does not prove absence of attrition bias.
Hughes et al. Accounting for missing data in statistical analyses: multiple imputation is not always the answer. 2019. explains why missing-data decisions depend on the analysis and assumptions. A complete-pair analysis is not automatically unbiased because most participants returned, and a more complex method is not automatically correct because it uses more records.
Separate change from causal effect
In an uncontrolled pre–post evaluation, improvement could reflect the intervention, changes over time, repeated testing, regression to the mean or other influences. A paired statistical test can address a comparison of measurements; it cannot manufacture a control group.
If the study includes a comparison group, the relevant effect is not established by showing a significant change in one group and a non-significant change in the other. Analyse the intended between-group contrast using a method appropriate to the design.
Report the flow and the estimate together
Show the number eligible for each assessment, observed at each time point and included in the main analysis. Describe missingness and handling procedures. Reporting frameworks such as STROBE. Checklist for cross-sectional studies. can help identify relevant transparency requirements for observational work, using the version appropriate to the design.
Then report the estimated change, its uncertainty, the analysis population and the study’s causal limits. The first result worth trusting is often not the p-value. It is the participant count that reconciles from recruitment to analysis. Continue with quantitative results reporting.
Continue your research
Three useful next steps for this topic.
Research notes, once a week
Practical research guidance, useful tools and funding opportunities in your inbox.